This is the third in a series of blogs related to the 2019 demographic changes. The first dealt with changes in metro area median family incomes and the second dealt with tracts that flipped from low/mod to not low/mod, and vice-versa. As discussed, the 2019 demographic file features some reorganization of metro areas affecting counties that are part of an MSA in both 2018 and 2019. Meanwhile, this blog deals with changes to definitions of metro areas from counties that went from non-metro to being part of an MSA, or vice-versa.
In total there were 81 such counties. There were 47 that were considered non-metro in 2018 and in 2019 are considered part of an MSA, and 34 went the other direction. Below is a map of these counties. In red are the counties that were dropped from metro areas. Blue shading indicates a county that had been non-metro and in 2019 is added to an MSA. The map shows that these counties are distributed across many states and several regions.
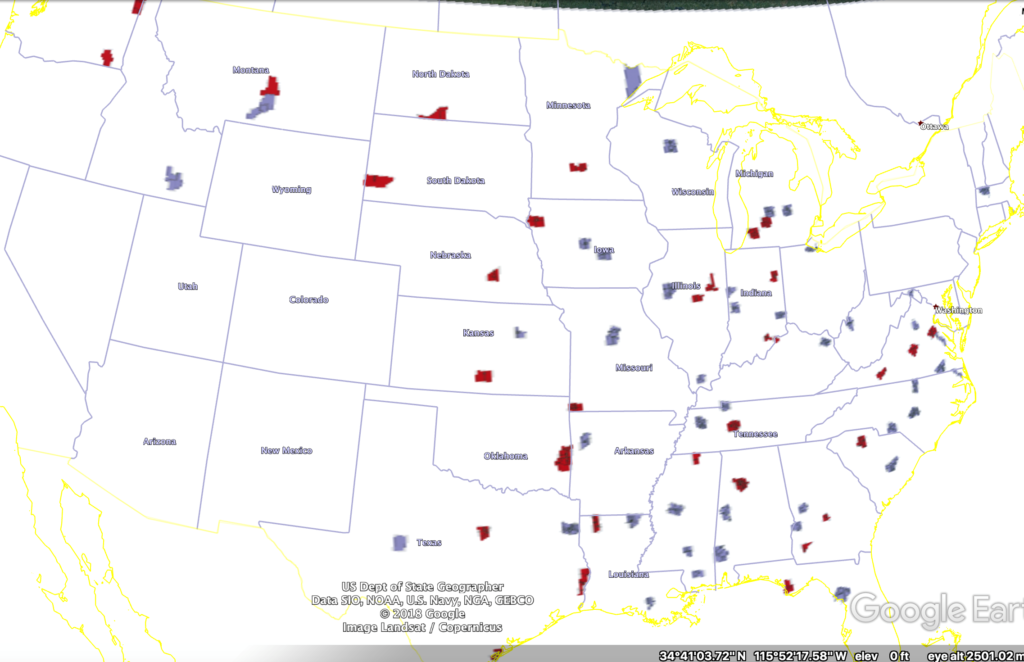
Looking at the 2018 mortgage market, there were 46,492 applications in those counties that were added in 2019 to MSAs, while there were 31,382 applications in those counties that were dropped from MSAs. In total, this represents a 0.5% share of the 15.1 million mortgage market.
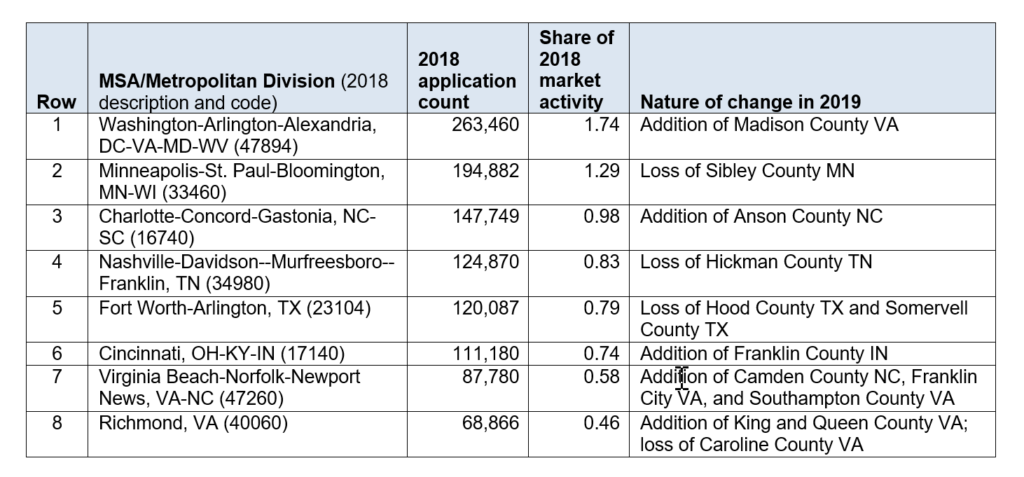
What are the biggest mortgage markets affected by such a change?
Below are the top eight mortgage markets that are affected. In the rightmost column below is a description of the addition or loss of counties in the metro area.
In total, there are 410 metro areas (MSAs or Metropolitan Divisions). Of those, there are 71 (17.3%) that are affected by an addition or loss of a county. These 71 metro areas account for 13.6% of the total mortgage market in terms of application volume.