This is the second blog in a series about the the 2019 FFIEC census demographic file which was released on August 30, 2019. Into that file FFIEC incorporated September 2018 Office of Management and Budget MSA/Metropolitan Division boundary definitions. As a result there some important changes to tract income categories to be aware of.
Roughly 5.0 million people reside in the 1,190 census tracts where the income category changed in some way. That equates to 1.6% of the US population, including in the 50 states, Puerto Rico, and the District of Columbia. In 2018, there were 193,841 HMDA applications received in these changing geographies, a 1.3% share of the total HMDA application volume.
Of particular importance are the tracts that 1) flipped from moderate to middle income (310 tracts), or 2) flipped from middle income to either low or moderate income (174 tracts). Both sets of tracts account for about 0.2% of the 2018 HMDA application volume.
This blog drills down on the second group of 174 tracts as a potential source of new opportunities to obtain CRA credit for low/mod lending. There were 28,454 HMDA applications in those tracts in 2018. Below is some LendingPatterns(TM) analysis of those applications.
What types of products are consumers applying for in these census tracts? One can use LendingPatterns™ to study the 2018 mortgage market in any set of tracts, in terms of:
Loan type
Loan purpose
Lien status
Owner occupancy
Construction method
Reverse mortgage vs not
Open vs closed end credit
Commercial vs consumer purpose
ARM vs fixed rate loan
In which counties and metro areas are these applications concentrated? The table below shows the distribution of 2018 applications by county:
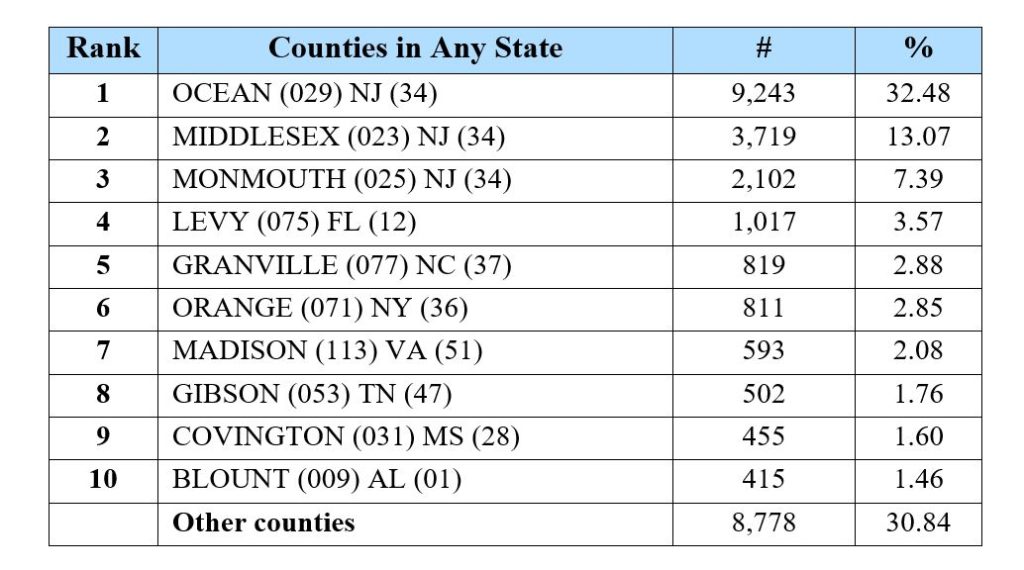
Roughly 53% of the 28,454 applications referenced above came from four New Jersey counties (Middlesex, Monmouth, Ocean, and Somerset) which in the 2018 demographic file were part of various Metropolitan Divisions within the New York-Newark-Jersey City, NY-NJ-PA Metropolitan Statistical Area. In the 2019 demographic file, these four counties make up the newly created “New Brunswick-Lakewood, NJ Metropolitan Division”.
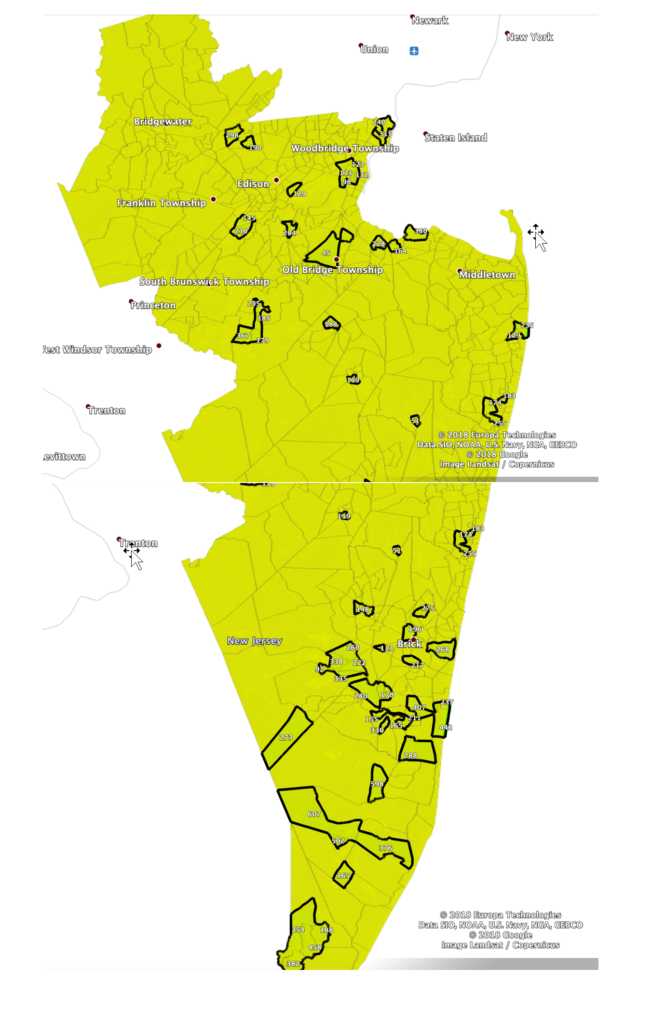
Below are some maps of the New Brunswick-Lakewood, NJ Metropolitan Division that were produced using to highlight those tracts with bolded outline that flipped from middle to low or moderate income.
The numbers indicate the number of 2018 applications taken by all lenders in those tracts. For the other tracts in the Metropolitan Division, no activity is shown. First the northern portion of the Metropolitan Division is shown, then the southern portion.