Institutions who are covered by the Community Reinvestment Act (CRA) will want to pay particular attention to recent changes to MSAs and Metropolitan Divisions and median family incomes (MFIs). In the HMDA/fair lending world, whether you are looking at a distribution of applications by metro area or applicant income category (low/moderate/middle/upper), the changes will be noticeable. So even non-bank lenders will want to understand the changes.
What happened? The FFIEC released on August 5 the 2019 MFIs for MSAs and Metropolitan Divisions. Those MFIs are based on MSA/Metropolitan Division geographies which reflect Bulletin 18-04. That bulletin was released by the US Office of Management and Budget in September 2018.
What changed? Bulletin 18-04 reflects the following types of changes:
1. Changes to the five-digit code used to refer to the MSA/Metropolitan Division;
2. Changes to the name used to refer to the MSA/Metropolitan Division; and
3. Changes to the set of counties that make up an MSA/Metropolitan Division
The FFIEC has not yet released the census demographic file for 2019 which it usually posts here. Once that file is available, LendingPatterns(TM) and Fair Lending Magic(TM) will be updated with new lookups for MSA/Metropolitan Division, and borrower and tract income categories.
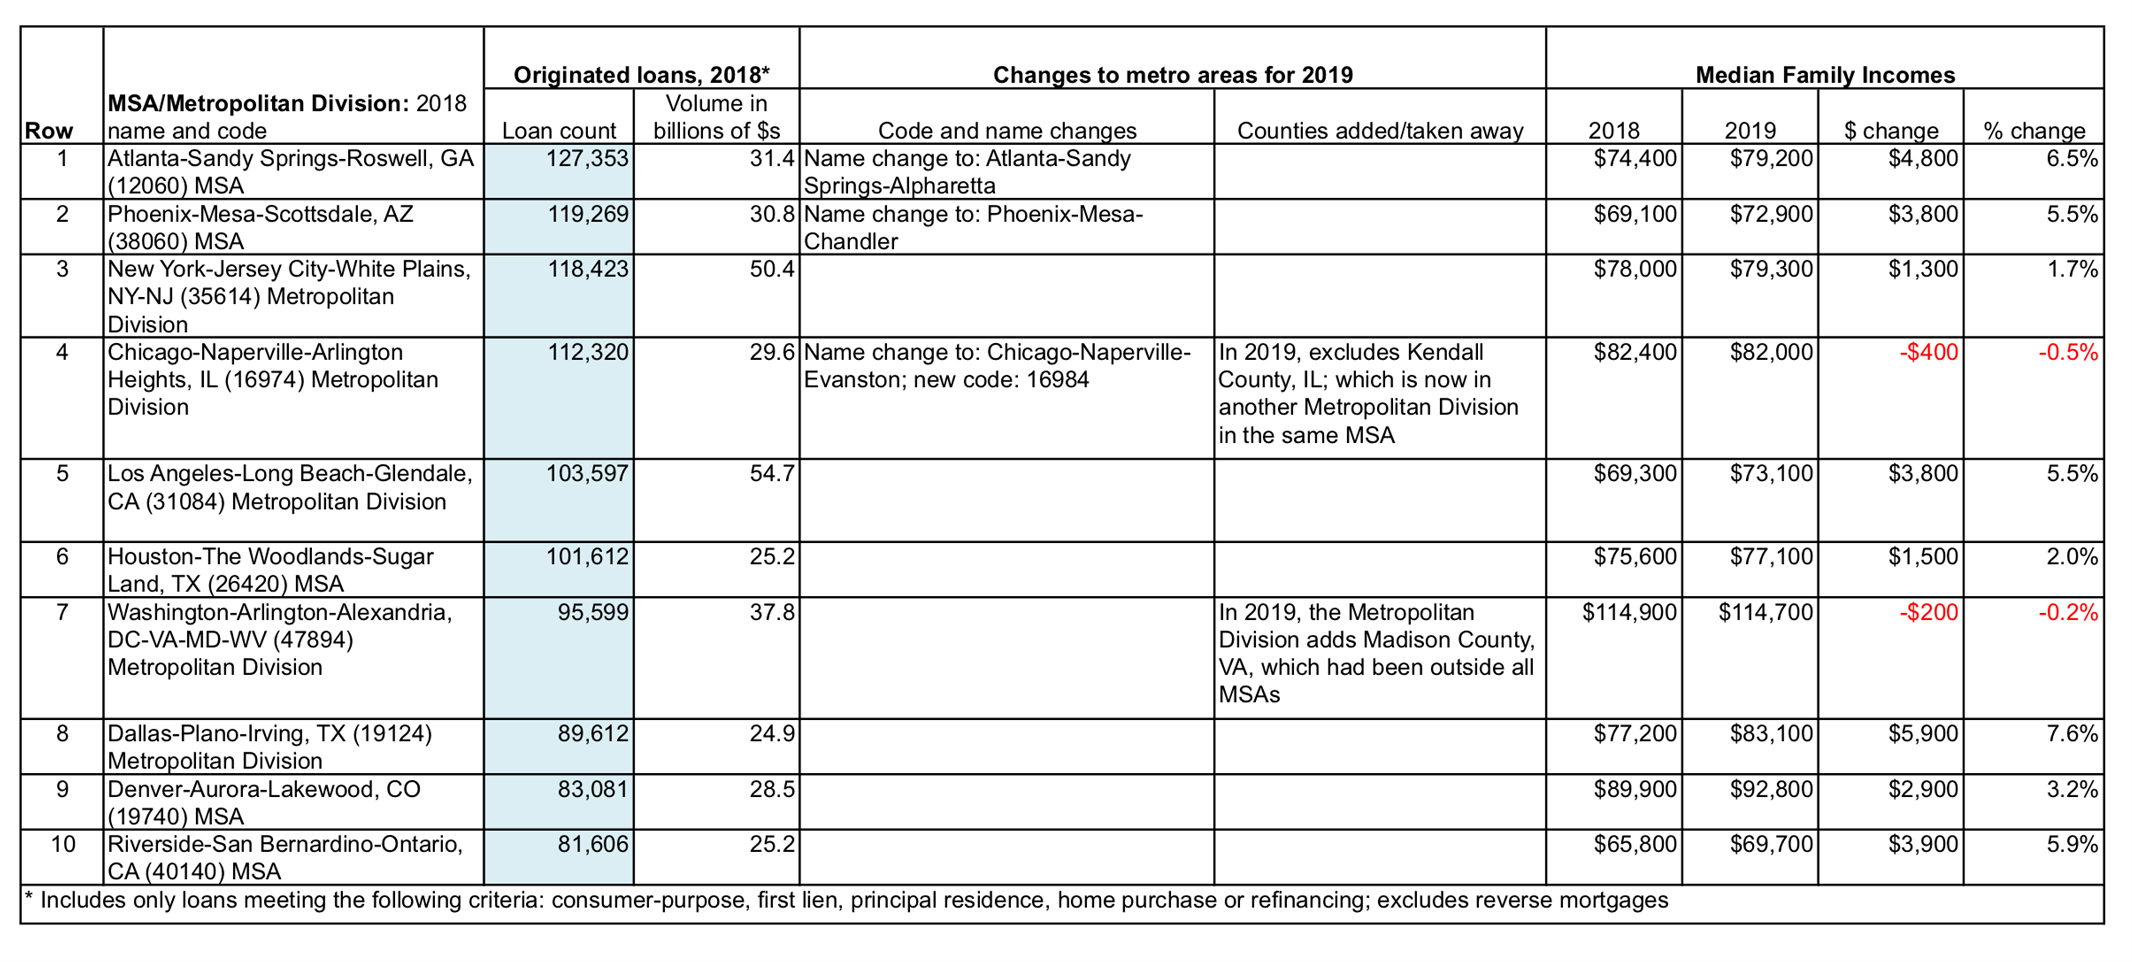
Not every MSA/Metropolitan Division is affected by the 2019 changes. The table below illustrates some examples, focusing specifically on the top 10 metro areas in terms of the number of originated loans in the 2018 HMDA data. The table is sorted by loan count. One can see in the table examples of all three types of changes. In the four columns on the right, one can also see changes in MFIs by metro area.
Of these ten areas, the largest change in percentage terms was in Dallas, TX Metropolitan Division, a 7.6% increase. Between 2018 and 2019, there was no change in the list of counties that comprise that metro area.