
The term “HMDA Outlier” is used by the National Credit Union Administration (NCUA) and other regulatory agencies to describe part of their criteria for selecting financial institutions for fair lending reviews. Unfortunately, it can be a daunting task for a Compliance Officer to get a handle on their Home Mortgage Disclosure Act (HMDA) data and answer the question: “Is my credit union a HMDA Outlier?” This article shares a straightforward methodology, using the public HMDA data, to identify HMDA Outliers.
Background
The NCUA Guidance on Fair Lending Examination Programs states “Federal credit unions that are HMDA Outliers and demonstrate the potential for higher fair lending risk are subject to a fair lending exam in accordance with the FFIEC exam procedures.” In that guidance, the NCUA also states that it will review the credit union’s annual HMDA report, and if that review indicates that the credit union’s lending practices fall outside the normal range with regards to pricing, denials, withdrawals, or lending terms (when compared to other financial institutions) the credit union is considered a HMDA Outlier.
A Data Based Approach to Understand Outliers
In keeping with the NCUA guidance, ComplianceTech suggests using a statistics-based approach to determine which federal credit unions are HMDA Outliers. This approach computes an average score (e.g. denial rate, etc.) for a group of “peer” lenders, and then determines which of the individual lenders’ scores are far enough from the average to be considered an outlier.
In the world of statistics, the Standard Deviation provides a benchmark for how far from the average a lender’s score can be before it’s considered an outlier. The general rule of thumb is that a lender’s score should be within 2 Standard Deviations (plus or minus) of the average of its peers’ scores to be considered “normal”. This rule of thumb is useful because statistics suggest that approximately 95% of the scores should be within 2 Standard deviations of the average score. (Assuming the data is normally distributed). Applying this standard statistical approach to an analysis of the public HMDA data enables credit unions to see how they perform compared to other lenders. As NCUA notes, it is possible to identify institutions that are outliers when it comes to pricing, denial rates or other data that’s reported in HMDA.
Figure 1 below shows an illustration to help explain what we are referring two when we look at statistical HMDA Outliers. The middle point (the average) is labeled “X” and each Standard Deviation is labeled “S”. This curve, and the percentages below it, show the likelihood that a score will fall within 1 Standard Deviation (68%), 2 Standard Deviations (95%) or 3 Standard Deviations (98%) of the average.
Figure 1: Diagram Showing Standard Deviation
![C:UsersDanaAppDataLocalMicrosoftWindowsINetCacheIEVWSNPUDHnormal-distribution-and-standard-deviations[1].jpg](https://lh6.googleusercontent.com/rg_tmPjLVQF3jc3ge_OvWUzcx6D5n7I5Fk1fo0XFKVxzERb9mT4mChztohYAlG1EIZZ_oisZXpTv74jaTz7RmX1HLgDqj-f39rkgDwxVY4i2FLWas4lQ9-eFg-pMYrexMohrVXI)
For example, using a statistical approach, a credit union may be interested in determining whether they are a HMDA Outlier with regards to denial rates (overall or for a particular subset of borrowers). To answer this question, the lender would determine what the individual denial rates are for each lender in a peer group, compute the average denial rate for the peers, and then compute the Standard Deviation of the peer denial rates. Finally, the lender would compare their denial rate to the average. If it’s more than 2 Standard Deviations above or below the peer average then they are considered a HMDA Outlier. This approach can be used to determine whether the credit union would pop up on the NCUA radar as a HMDA Outlier for denial rates.
Where do I begin? An Example to Explore Denial Rate HMDA Outliers
A credit union may be interested in seeing how their denial rates compare to all lenders or only credit unions, and whether they would be considered a HMDA Outlier.
Table 2 and Table 3 show examples of analysis providing all of the information required to determine which lenders are denial rate HMDA Outliers (in the Washington DC MSA). Table 2 shows HMDA Outliers based on all lenders, while Table 3 shows HMDA Outliers based on NCUA lenders only. Note that the complete reports show each denial rate for all of the lenders in the peer group, the average denial rate, the Standard Deviation, and the lenders whose denial rates are more than 2 Standard Deviations above the average. The report ranks lenders with at least 20 applications in the Washington, DC MSA.
Table 2: 2020 HMDA Outlier Analysis– Denial Rate – All Lenders
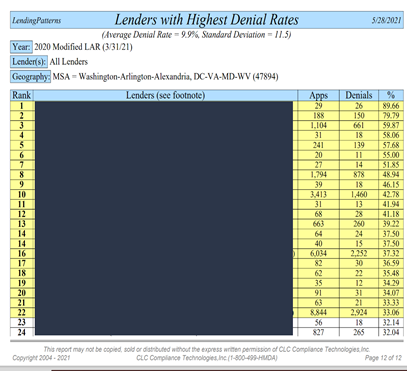
Table 3: 2020 HMDA Outlier Analysis – Denial Rates – NCUA Lenders in Washington, DC MSA
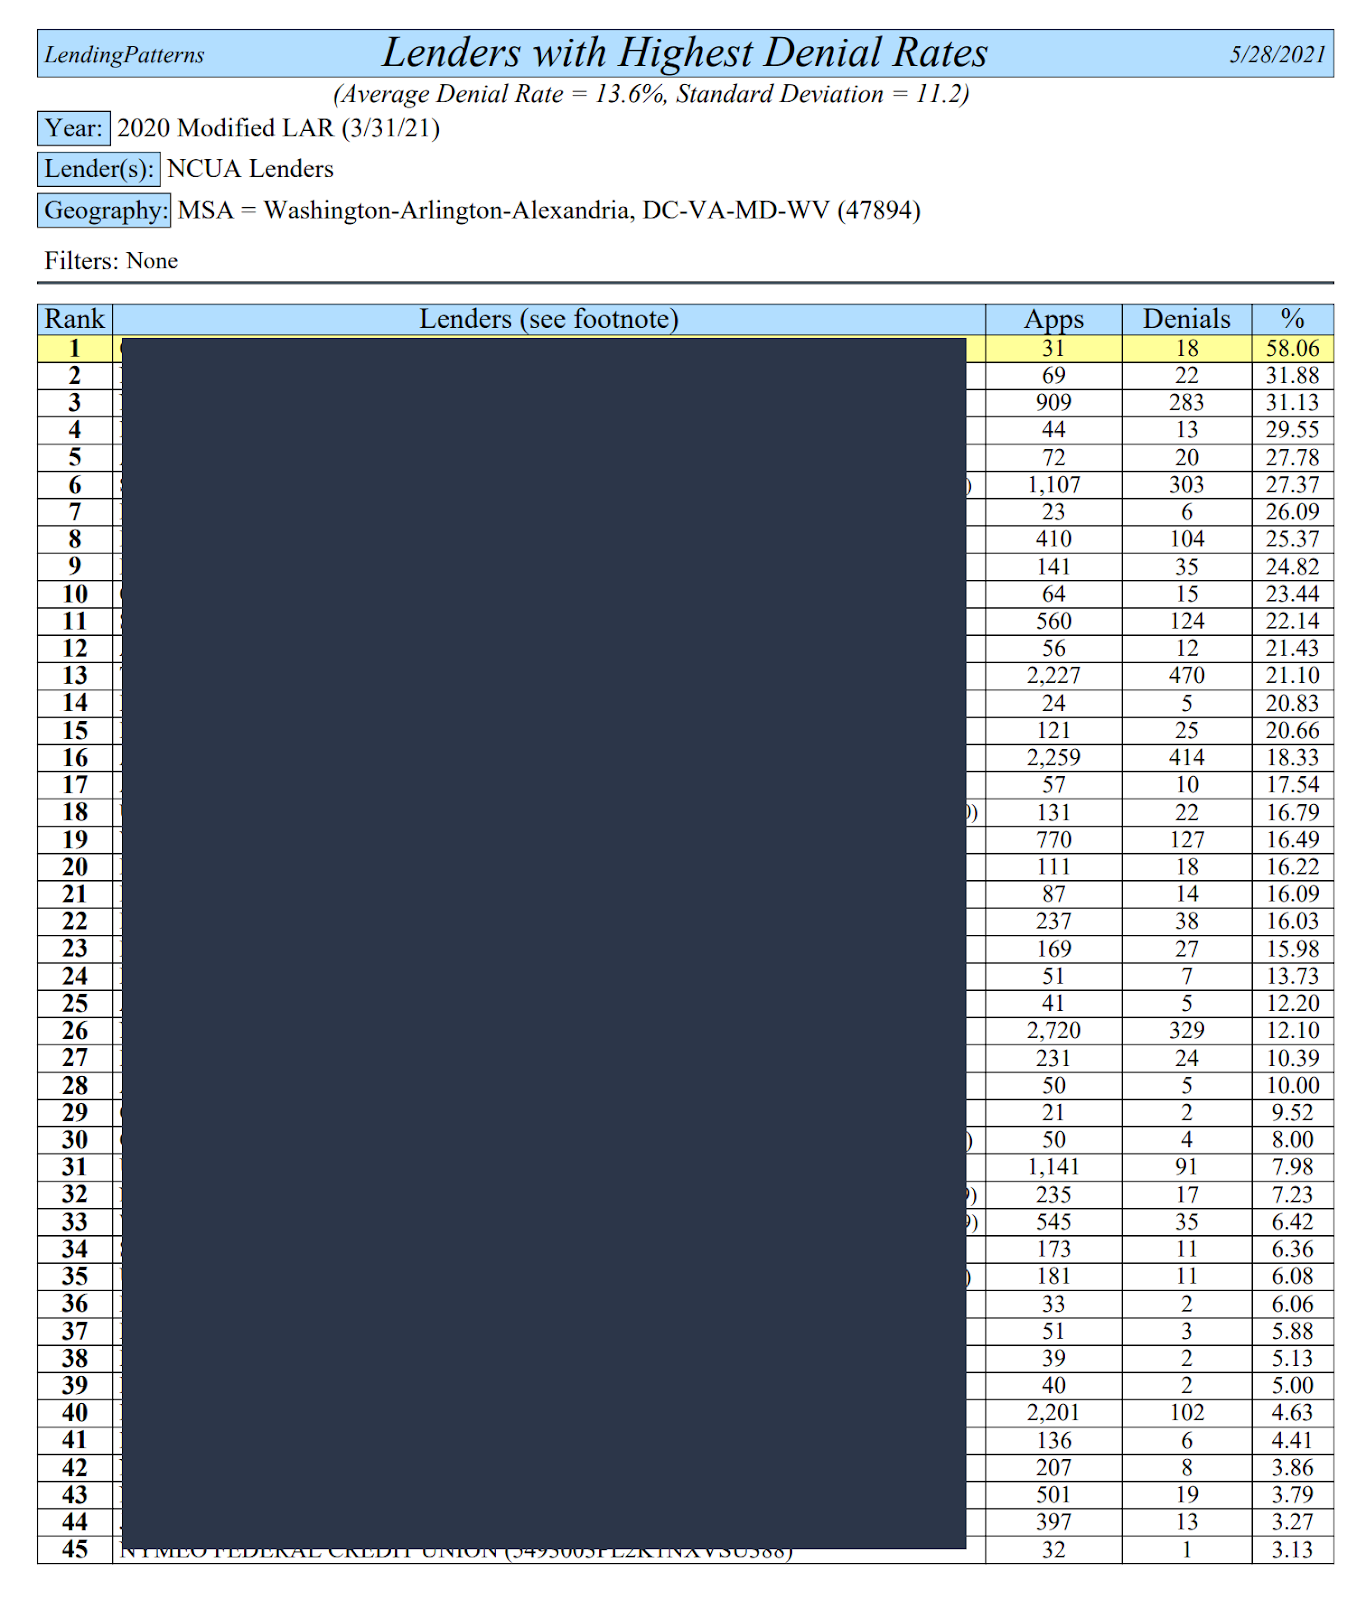
The denial rates in yellow are more than two standard deviations higher than the average and therefore, these lenders would be considered a HMDA Outlier for denial rates. Subsequently, the lender may choose to do a deeper review of denial rates and see whether or not it occurs with a particular group of borrowers.
The examples above focus on overall denial rates. Let’s remember that there are many other ways to review the data for outliers. Other areas to test for HMDA Outliers include pricing and denial disparities. Each of these tests can be performed with “drill down” to see if there is anything in the HMDA to suggest differences among race, ethnicity, and/or gender.
Every credit union has the ability to review their latest HMDA submission file to determine whether their data suggests that they are HMDA Outliers. It’s a great time to get a handle on potential fair lending issues in the 2021 HMDA data before the aggregate data is released in September. The goal of this blog posting is to give credit unions a statistics-based approach to determining whether they have HMDA Outliers that will place them on the radar of the examiners.