Analyzing branch penetration helps lenders see how many branches are in minority areas. Several legal cases point to the importance of self-monitoring by conducting a branch penetration analysis showing your branches’ concentration in high-minority areas.
In March 2017, the U.S. Department of Housing and Urban Development (HUD) reached a fair lending Conciliation Agreement with a bank in Illinois, resulting from allegations that the bank’s branch concentration in low minority tracts constituted a violation of the Fair Housing Act. We know from this settlement that HUD determined that the lender’s business service areas excluded majority Black and Hispanic neighborhoods.
Branch Analysis
The easiest way to self-monitor is to conduct a branch penetration analysis. It requires looking at how many branches your company has in minority areas compared to all other lenders with branches. It is possible to count the number of total census tracts, and the number of census tracts that are majority-minority and then, calculate an overall branch penetration rate. Ideally, the percentage of branches in majority-minority areas won’t differ dramatically from the overall majority percentage.
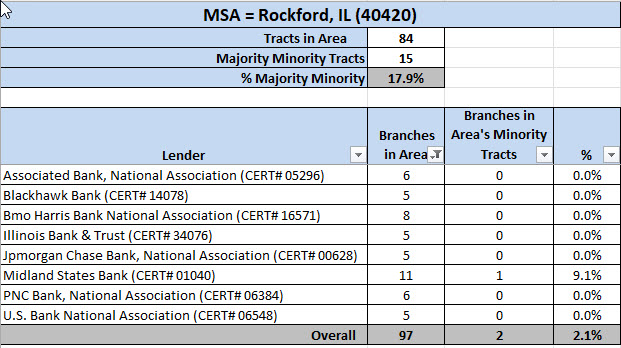
In the example below, we used LendingPatterns™ to generate a spreadsheet to determine the number of lenders with five or more branches in the Rockford MSA. There is a total of 84 census tracts in the MSA, of which, 15 of tracts are majority-minority. The table below shows eight lenders with branches in the MSA in 2016. Only two of the 97 bank branch locations are in a majority-minority census tract.

Mapping
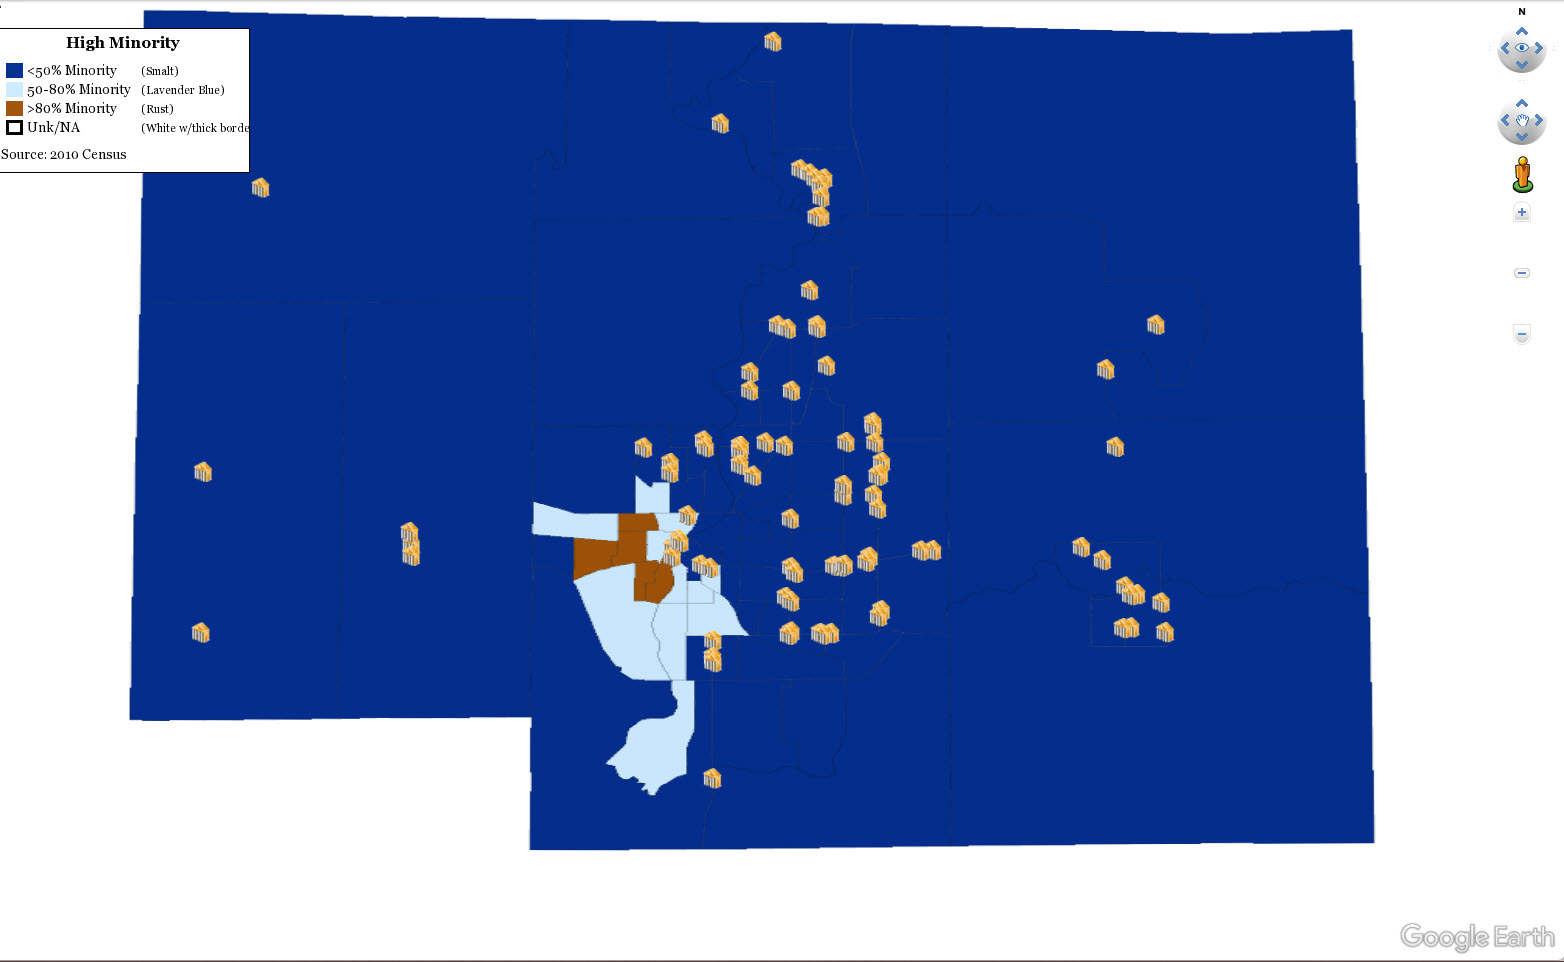
LendingPatterns™ also encourages mapping to illustrate branch penetration. The map below shows the bank branch locations with yellow buildings. You will want to consider analyzing the number of branches in majority-minority census tracts, especially as the new American Community Survey (2011-2015) census data shows changing demographics nationwide.


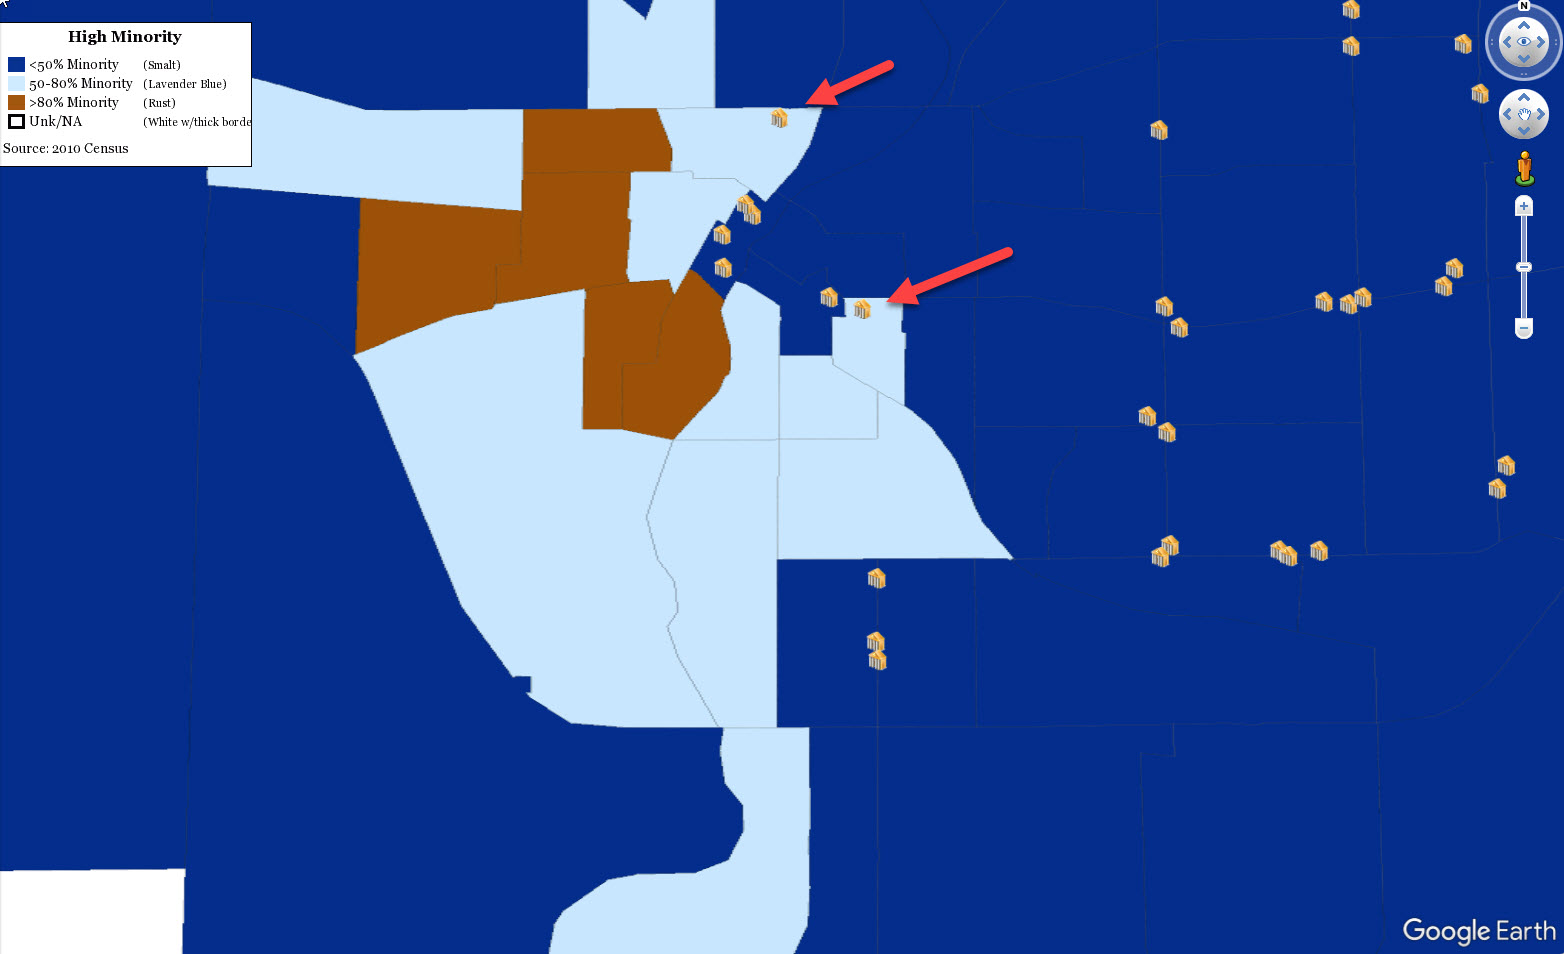
Zoomed in version of the map to show only 2 branches in MMTs

Recent Comments