
Many people believe that the signs of a healthy economy are in the number of mortgages being applied for by Americans, but one of the true indicators of economic and financial health is in the secondary market, where government-sponsored enterprises (GSE) choose which mortgages to purchase and securitize from financial institutions.
Let’s take a look at secondary market activity from 2018 and what it means for the future.
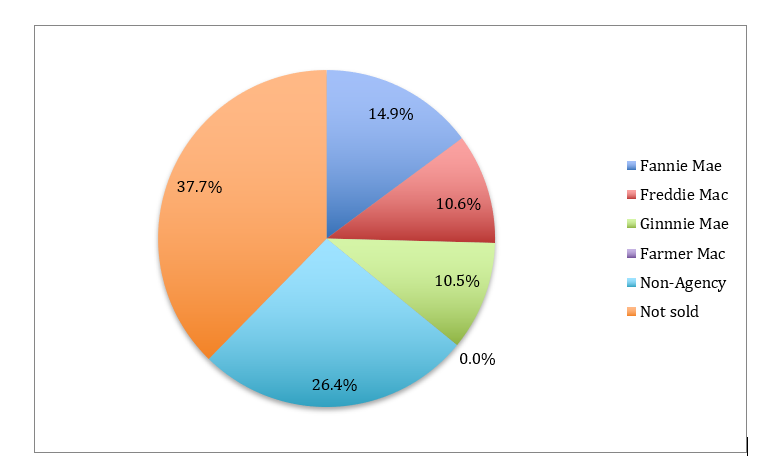
Breakdown of Share by Investor
According to the 2018 HMDA reports, the breakdown of secondary market activity followed the traditional trends of mortgage purchases by GSEs and other government entities, with Fannie Mae coming in first at 1,146,786 mortgages, followed by Freddie Mac at 815,893, Ginnie Mae at 809,202, and Farmer Mac at 650.
Changes in Investors and Securitizers
The biggest change that analysts will notice with this year’s HMDA data release is that the previous Non-Agency category has now been broken down into a variety of categories. This is an important distinction to make because it will allow financial institutions to better design and market their mortgages to investors and securitizers, and potentially increase secondary market activity.
Alongside these new categories, readers will also see a decrease in share among GSEs. The originations market has grown strong as a whole compared to 2017 (7,720,995 mortgages vs. 7,339,057), and the share that GSEs purchase has fallen as the number of unsold mortgages has risen.
This, however, has more to do with new 2018 HMDA reporting for open-end and business/commercial loans than the fault of secondary market investors.
What Does The Data Tell Us?
The breakdown of Non-Agency purchasers into two reporting codes: 71 for “Credit union, mortgage company or finance company” and 72 “Life insurance company” allows us to see how active these investors are. For example, we can now drill down to understand the types of loans that life insurance companies prefer to purchase and who is selling to them. A plurality of loans bought by life insurance companies were in the conventional, 1st lien, home purchase, owner occupied, 1-4 unit property “pseudo product”. Appetite for spread at life insurance companies is actually higher than at the GSEs (Fannie and Freddie), 19.5% versus 2.8%. Thus, the data show that life insurance companies are not just an outlet for income property loans and multifamily loans as has been generally believed within the industry. Take advantage of the drill-down filtering ability in LendingPatterns™ to improve your network of investors.
HMDA data for secondary markets is critical for financial institutions planning their 2020 strategies, but our team at ComplianceTech is always ready to sit down with you and decipher the data. Visit our team online and find out how we can help you stay on the right side of compliance laws and in the sold categories of data reports.