Finally, we can take the guess work out of describing the mortgage loan preferences of millennials. With the expanded 2018 HMDA data fields, we can analyze lending by the applicant’s age. This not only gives us a chance to better describe the typical millennial applicant, but we can also compare them to all other age groups. Defining a millennial is thorny, as there is no exact date range. So, I looked to the experts at Pew Research Center. According to Pew, the term “millennial” applies to only those people born between 1981 and 1996 (between the ages of 22 and 37 in 2018). The public HMDA data does not divulge the specific age of a borrower. The CFPB will disclose the data in 10-year bins, with a bottom code for ages under 25 and a top code for ages over 74. The age bins in LendingPatterns™ are as follows:
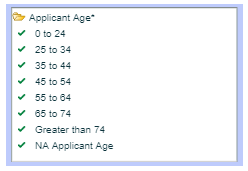
Given the constraints of the 10-year bins, the best that we can do to match the bins with the millennial age span is use 0-34. I realize that millennials ages 35 – 37 will be excluded from the analysis, while borrowers age 21 and under will be included in the millennial group even though they are not technically millennials.
WHAT THE DATA REVEALS
Based on the 2018 Modified LARs released by the CFPB on June 10, 2019 there were 12.66 million loan applications (excluding purchased loans Action Code 6 and Reverse Mortgages). Millennials applied for 2.7 million loans, representing about 21% of the overall activity. Conversely, non-millennials accounted for 77% of all loan applications or 9.77 million applications. The percentages sum to less than 100% due to the small Applicant Age “not applicable” bin. The table below shows the majority percent for key HMDA fields for millennials compared to non-millennials.
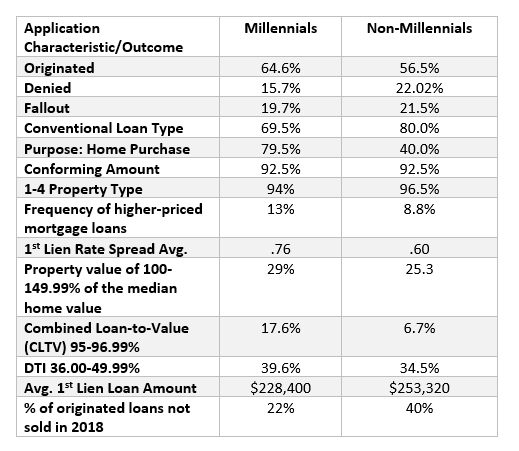
Overall, millennial borrowers are not too different from other generations. However, one can see that millennials are less likely to use conventional programs and are more likely than non-millennials to be seeking home purchase money. This is probably due to millennials looking for money to buy their first home. One major distinction: portfolio lenders prefer to keep the loans made to applicants 35 and older on their own books. A couple of interesting findings not shown in the table: in terms of property value, the largest segment of non-millennials is in the 150 or more percent of median home value category, at 33% of non-millennial borrowers. And with respect to CLTV, the largest share of non-millennial borrowers is in the 0-79.99% category. Not surprisingly, older borrowers live in more expensive homes and have more money to put toward cash down payments.
TOP LENDING AREAS
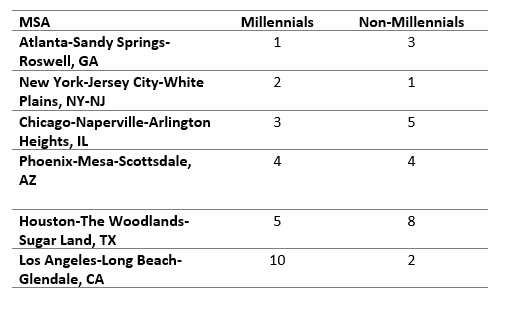
For the most part, the top MSAs overlapped for the age groups. However, the order was juggled around.