Prior to 2018, HMDA reporting for lines of credit was optional. It turns out that in 2018 $21.1 billion in credit was extended in transactions within the following parameters:
- Conventional
- Second lien
- Home improvement
- Owner occupied as a principal or second residence
- Open-end lines of credit
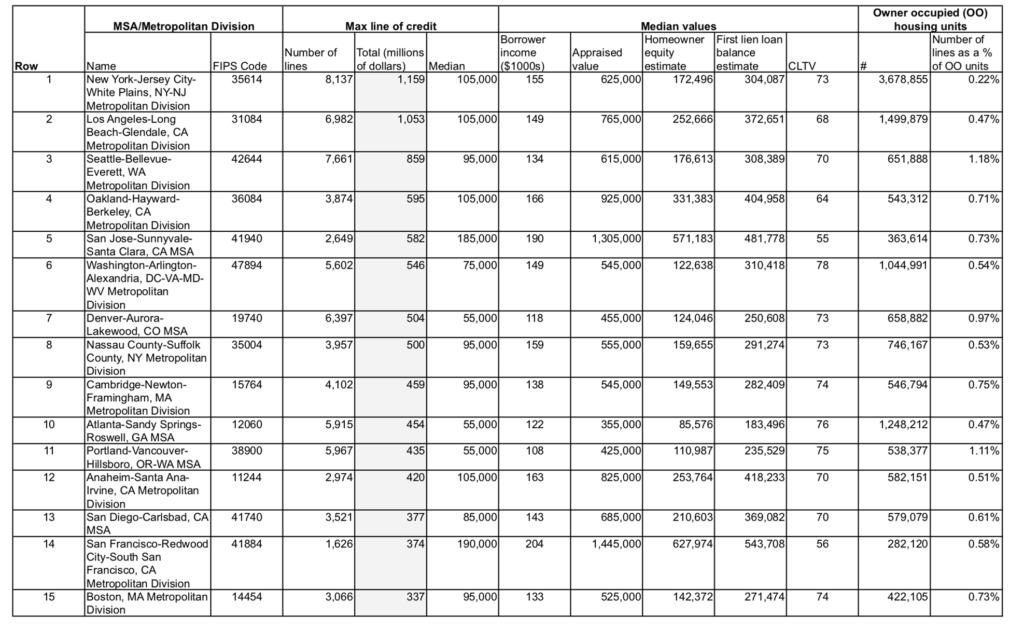
A big question is where these transactions are concentrated. This analysis focuses on the top fifteen markets which together account for 41.1% of the credit extended ($8.7 billion of $21.1 billion). Those fifteen markets are listed in the table below. One can see that all but one (Denver MSA) of these top markets is coastal.
In the table below, two columns not explicitly in the data were created to estimate the size of the homeowner’s equity and the loan balance on the homeowner’s first-lien loan obligation. These columns are computed based on: i) the second lien maximum line of credit extended, ii) the appraised value, and iii) the reported combined loan-to-value ratio (CLTV). Note that there is a little fuzziness around parts i and ii of this calculation, as the publicly reported values are essentially rounded to the nearest $10,000 value. Also note that the reported CLTVs treat the reported lines of credit as fully drawn.
The table below presents a framework that can be used to analyze not only home improvement lending but also refinancing and other-purpose credit (e.g., debt taken out to cover education or vacation expenses). Lenders and interested groups can look at whole metro areas or pieces thereof to learn about market activity within these products. A key consideration is which areas might be sensitive to a downturn in home values in light of high CLTV ratios. You can click on the table to enlarge the image.