Introduction: Why MSA/MD Reclassification Matters
Metropolitan Statistical Area (MSA) and Metropolitan Division (MD) reclassifications are more than administrative changes—they are strategic opportunities that can dramatically reshape lending portfolios. For financial institutions, these shifts provide:
- New Market Opportunities: Uncovering previously overlooked lending territories
- Risk Assessment Refinement: Enabling more precise geographic lending strategies
- Competitive Advantage: Identifying emerging low- to moderate-income (LMI) markets before competitors
In 2024, the Office of Management and Budget (OMB) redefined the boundaries of MSAs and MDs. This blog explores how these reclassifications affect tract income categories and the potential consequences in Home Mortgage Disclosure Act (HMDA) data for lending institutions and community organizations.
How MSA/MD Reclassification Impacts Tract Income Categories
Census tracts are categorized based on their Median Family Income (MFI), which is calculated as a percentage of the MFI for the MSA/MD to which the tract belongs. When the OMB redefines these areas, it can lead to shifts in the overall MFI of an MSA/MD, which in turn impacts the income classification of individual census tracts. This process can lead to changes in how these tracts are categorized, even when local economic conditions have not changed.
For example, let’s look at Cherokee County, GA, located just outside Atlanta. In 2023, census tract 130570904.02 was classified as a middle income tract. However, after the 2024 reclassification, it shifted to a moderate income category. This change occurred because the MSA’s MFI increased, and the ratio between the tract’s MFI and the MSA/MD’s MFI decreased, changing the income classification.
Map showing the Cherokee County tract being discussed as a shaded polygon. The outlined polygon represents the new Marietta, GA Metropolitan Division.

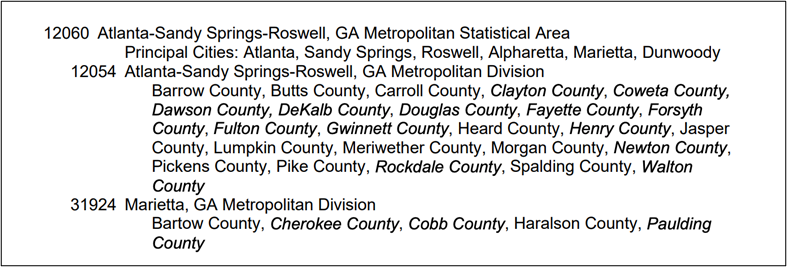
New definitions of Atlanta MSA at Marietta Metropolitan Division for 2024

Prior definition of Atlanta MSA for 2023

For lenders targeting low- to moderate-income (LMI) areas, this shift opens up new lending opportunities that weren’t available before. A bank that was previously not considering Cherokee County as a target for LMI lending may now find it beneficial to do so in 2024.
How HMDA Data Reflects the Impact of Reclassification
HMDA data provides a detailed look at mortgage loan origination patterns, and it can be used to track the impact of MSA/MD reclassification on lending trends. Between 2023 and 2024, 1,635 census tracts experienced changes in their income classifications as a result of redefined MSA/MD boundaries. These tracts collectively accounted for 2.03% of all mortgage loans originated in 2023—115,658 loans in total.
Some key trends observed in the 2023 HMDA data include:
- Top Lenders in Affected Tracts:
- Rocket Mortgage originated the most loans in these tracts, with 6,565 loans.
- The top eight lenders by volume were primarily non-depository mortgage companies and credit unions, which have less focus on lending in LMI tracts.
- PNC Bank, the largest bank lender in these tracts, originated 1,603 loans.
- Impact Across MSAs/MDs: There were 83 MSAs/MDs that saw at least one mortgage loan in 2023 being classified differently under the new 2024 MSA definitions. The two MSAs with the most loans impacted were:
- Washington-Arlington-Alexandria, DC-VA-MD-WV: 16,627 loans (14.4% of affected loans).
- Atlanta-Sandy Springs-Alpharetta, GA: 10,677 loans (9.23% of affected loans).
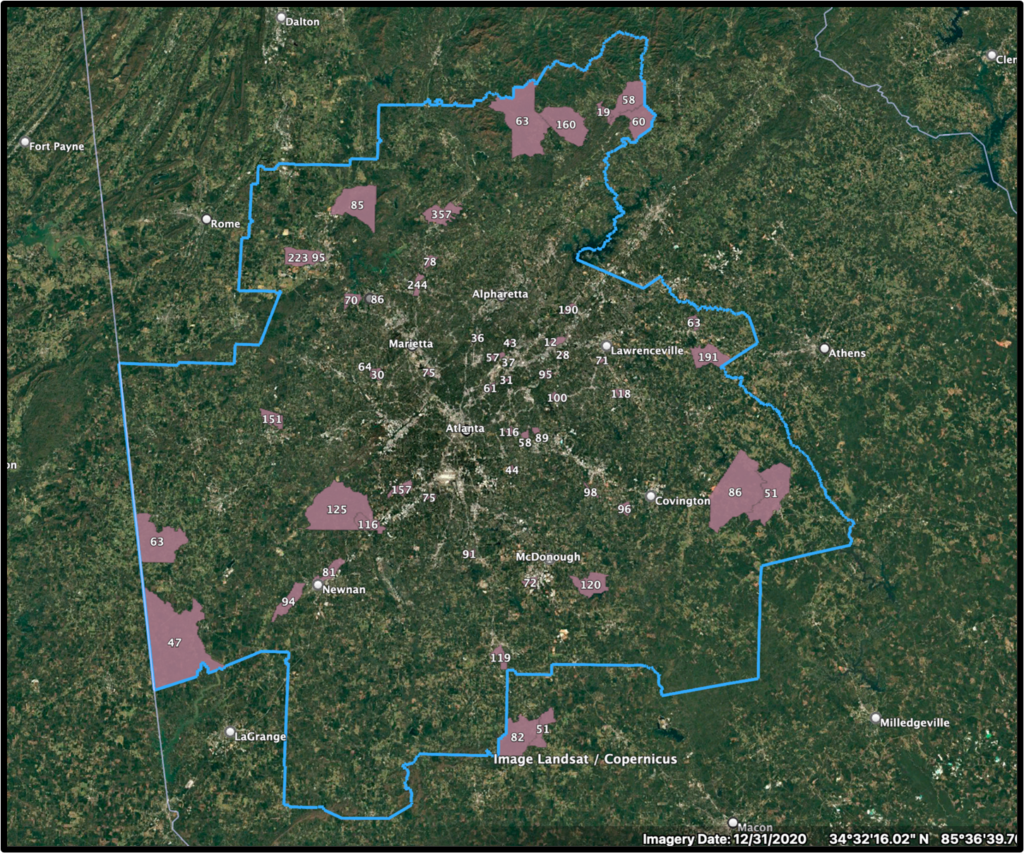
- Most substantive changes: There were 679 tracts which flipped from low/mod to middle/upper or vice-versa. In 2023, lenders originated 41,562 loans in these tracts. The map below shows a count of these loans by tract on a map which also shows the Atlanta MSA’s 2024 boundaries.
Count of loans in Atlanta MSA tracts that flipped from low/mod to middle/upper or vice-versa

Conclusion: The Importance of Tracking MSA Reclassifications
Key Takeaway: MSA/MD reclassifications are not just administrative updates—they’re strategic inflection points that can define your lending success. Tools like LendingPatterns™ and other mapping resources can help stakeholders monitor these changes and adjust their strategies accordingly. By staying informed about MSA/MD redefinitions and their impacts, lenders can make better decisions regarding where to focus their lending efforts.
Contact us today to take a deep dive into your data.

Recent Comments