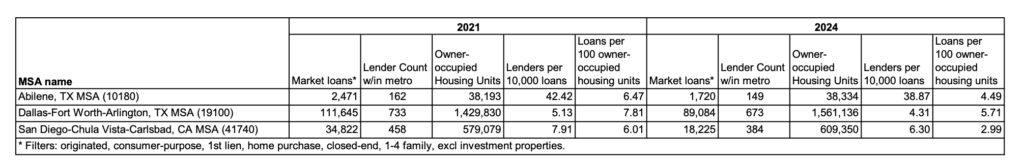
The latest look at top home purchase markets shows Texas leading in origination volume, but compliance professionals know those numbers tell only part of the story. A deeper dive into filtered HMDA data¹ reveals that market conditions vary widely across metros. For instance, Dallas-Fort Worth-Arlington TX MSA saw originations drop from 111,645 in 2021 to 89,084 in 2024, and its lender count declined slightly. Loans per 100 owner-occupied housing units also fell from 7.81 to 5.71, suggesting a market-wide contraction, not necessarily underperformance by a single financial institution.
In contrast, markets like Abilene TX MSA illustrate how smaller metros can show a very different lending landscape. Abilene’s lender concentration is notably higher, with 42.42 lenders per 10,000 loans in 2021, compared to just 5.13 in Dallas-Fort Worth. While originations are smaller in volume, the density of lenders relative to loans is striking. This indicates a more competitive, though smaller, market where lenders are potentially vying for a larger slice of a relatively limited loan pool.
This is where rigorous data analysis becomes critical. In San Diego CA MSA, originations in this loan category fell nearly 48% over the same period, and lender concentration rose, indicating tighter competition in a shrinking segment. Without controlling for market shifts, compliance assessments risk misreading patterns. Metrics like “loans per 100 owner-occupied housing units” or “lenders per 10,000 loans” are essential to forming a meaningful performance context. They help compliance teams distinguish between institutional issues and systemic trends, thus supporting more accurate fair lending evaluations and more credible CRA strategies.
Whether you’re seeking opportunities in underserved areas or trying to make sense of shifting competitive dynamics, LendingPatterns™️ is built to guide your decisions. With the ability to filter, compare, and contextualize performance across geographies, loan types, and timeframes, our platform equips compliance teams and strategists alike with the tools they need to spot emerging markets, assess lender saturation, and uncover risk or opportunity hiding in plain sight. Let us help you move beyond volume and into smarter, data-driven market engagement.
¹ Data reflects originated, consumer-purpose, first-lien, closed-end home purchase loans secured by 1–4 family owner-occupied properties.
Recent Comments