
The 2019 uptick in refinancings has been well-documented in the media and by mortgage trade organizations. LendingPatterns™ can slice and dice the HMDA data to shed additional light on this increase.
In brief, at a high level, I am seeing a 90.2% increase in the dollar volume of refinancing originations, compared to 2018 ($1.203 trilllion versus $633 billion).
That’s based on originated loan activity only, combining both rate/term and cash-out refinancings.
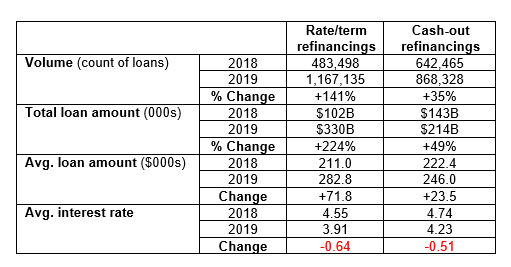
I used LendingPatterns™ to drill down on these changes in the table below, which focuses specifically on originated loans meeting the following conditions:
- Conventional
- Conforming loan amount
- 1-4 family
- First lien
- Principal residence
- Closed end
- Consumer purpose
The table shows that average interest rates fell by 50-60 basis points while volumes rose tremendously, especially on the rate/term side.
The 2019 figures are based on the 2019 Modified LAR data that were published by the CFPB on April 1st and that will be published within LendingPatterns™ by the end of the month.